
Our 2020 Market Outlook is being written as U.S. equities enjoy one of their best fourth quarters in history. It is hard to be pessimistic about equities today. The world’s major central banks have signaled every intention to support financial markets. Interest rates will not rise, meaning that even at the lofty price levels of many U.S. stocks, an argument can be made that valuations remain attractive.
Historically, coming off an exceptional year for equity gains in 2019, we can expect to see more, yet modest gains again the following year. Entering the fourth year of the U.S. Presidential Cycle (election year), we can expect a solid stock market. Going back to 1950, markets have enjoyed 13 up election years and only 3 down election years, with an average return of +6.6%. Finally, geopolitical risks seem to be fading. Traders seem to have rejoiced that the U.S.-China trade war is simmering down, as Donald Trump removed additional tariffs set to go into effect in December. In the U.K., the overwhelming reelection of Boris Johnson suggests that Brexit will also finally be resolved. One-off geopolitical risks, such as conflicts with Iran in the Middle East, should be quickly digested by uninterested market participants.
As natural skeptics, anytime we are presented with a “blue skies” scenario for equities, we become concerned. Investment sentiment towards stocks is extremely high, according to our WMA Market Sentiment Indicator. The indicator reached 96.1 at the close of December, the highest reading since July 2007. Once all the good news is known by the public, we have to ask who the marginal buyer will be to push equity prices higher. We are also dubious on the concept of the never-ending economic expansion. No one expects a recession to hit in the foreseeable future. Markets apparently believe that the Almighty Federal Reserve can stave off recession indefinitely. We know that this is not the case. The question is not if, but when, the current expansion will end. While we can only foresee a garden-variety recession, quite unlike 2007-2009, stock prices should finally see some of the excesses of the past few years washed out.
I. 2019 Market Review
As we turn the calendar to a new decade, financials markets experienced unequivocally the most exceptional 10-year stretch in history. From world central banks extending crisis period monetary policy throughout an entire economic expansion, to the rise to dominance of algorithmic, high frequency trading, to the longest and greatest percentage gain equity bull market in history, no one could ever have imagined the events that would transpire since the Financial Crisis.
Can we expect more of the same in the 2020s? We have learned never to underestimate the willingness of central bankers and the governments to prop up financial markets. While we have believed that educated economic leaders would not be so stupid as to create a bubble in financial assets, we have been wrong. Kick the can down the road and hope that the accident doesn’t occur on the current leaders’ watch. Perhaps we are too pessimistic and central bankers have found the remedy for recessions (after 350 years of central banking). Or perhaps central bankers will be able to deflate assets prices in an orderly fashion as liquidity is withdrawn from the economy the day inflation becomes an issue again. In any case, the answer to the denouement of the “great monetary experiment” will be known within this new decade.
Our 2019 economic outlook, written last December 2018, was in line with what played out over the past 12 months. We noted that the ISM PMIs, as well as the Leading Economic Indicators, were not giving impeding calls for recession. We warned,“speculating on the end of a late-cycle economic expansion can leave your portfolio mis-positioned should the expansion drag on.” This is what has played out, as the U.S. is now experiencing the longest expansion in history.
In terms of our 2019 equity market outlook, written as equity markets were plunging last December with an inverted U.S. Treasury yield curve, we wrote that “higher interest rates in the U.S. and less accommodative monetary policies from major central banks will reduce liquidity on financial markets.” As we now know, the Federal Reserve did a 180-degree turn in monetary policy and instead of hiking rates twice, the Fed cut rates three times. Liquidity flooded back into markets and the stock market surged to its best yearly gain since 1997.
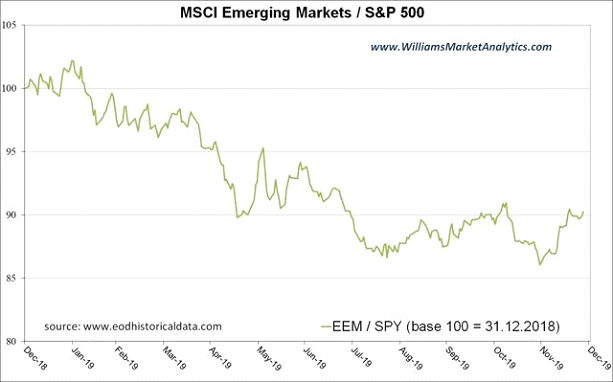
We noted last December that Emerging Markets (EM) and the S&P 500 undergo long periods of relative outperform/underperformance. Since 2011, the EMs have underperformed the S&P 500 buy -65%. In the 1990s Bull Market, the S&P 500 blow away EM. In the Tech Bubble burst and 2002-2007 Bull Market, it was EM stocks that dominated. We said that whenever the U.S. market tops out, EM markets are likely to begin a multi-year period of out-performance. As shown in the 2019 relative price chart below, EM stocks underperformed by another -10% in 2019, as a top in the S&P 500 remains elusive.
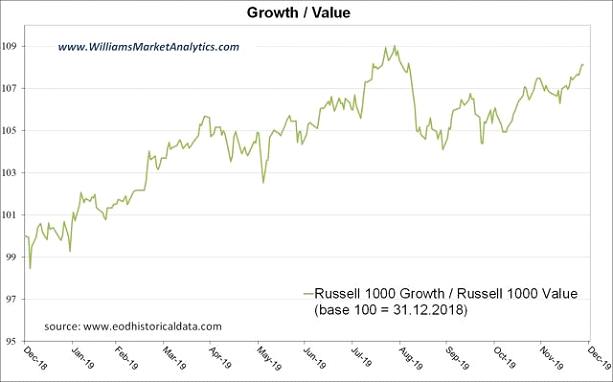
We also believed that the Q4 2018 correction would mark a rotation from Growth leadership to Value leadership. The correction turned into a massive buy-the-dip opportunity and Growth resumed leadership, although Value has held steady since late summer, as shown in the chart below.
As for sector allocation, we were constructive on the late-cycle plays in Energy and Basic Materials. Most Energy indexes finished the year lower while Basic Materials were close to market performers, up +23%.
Our bond market outlook was upended by the Fed’s 180-degree pivot on interest rate policy. The U.S. 10-Year T-Note finished 2019 at 1.87%, a far cry lower than the 2.69% at the end of 2018. We were cautious on credit, given the corporate debt bubble and the Fed’s policy tightening. Credit however bounced back, with the Barclays High Yield Bond ETF (JNK) bouncing over +9% from the 2019 year-end lows.
Our big call in the bond market was to stay long Emerging Market Local Currency debt. The was also the largest position in the DGR Strategy throughout the year, with a 20% weight. This was not a bad call, in terms of bond allocation, as the total return on the EMLC was nearly +10% in 2019. As we detail below, we remain constructive on EM local currency debt for 2020.
In commodities, we were very bullish on gold and silver at the start of 2019. We copy below the chart of the S&P 500/Philadelphia Gold & Silver Index used in our 2019 Market Outlook.
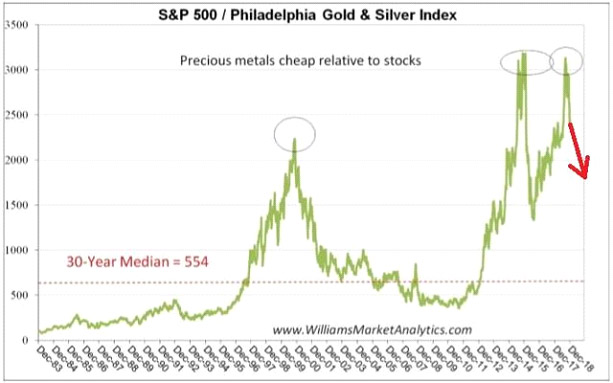
The red arrow marks the actual progression in 2019 of this relative curve. We wrote:
Looking at the S&P 500 relative to the Philadelphia Gold & Silver Index, we see that precious metals are historically very cheap compared to stocks. An allocation to Gold and the Gold Miners also makes sense for 2019 as a hedge against a Fed monetary policy error, Dollar weakness, and late expansion inflationary pressures.
The Philadelphia Gold & Silver Index finished 2019 up over +50%. The S&P 500 was up +29%
Finally, in our 2019 currency market outlook, we proclaimed to be dollar bears:
The Fed’s tightening cycle is well in advance of those of other world central banks. The Dollar Index reflects this monetary policy lead. For the Dollar to continue to rise, we’ll need to see the Fed carry through with at least two rate hikes in 2019, the U.S. economy perform better than expected (and other developed nations have disappointing growth), and foreign central banks carry on with their crisis-level monetary policies. This is too much to ask for. We are Dollar bears.
The dollar did rally with risk assets in January and continued a slow levitation until September. As we close the year, the Dollar Index will have fallen back to pretty much unchanged. Our bearish call on the dollar was premature, but we don’t expect the Fed to reverse course again and begin raising rates, which would further benefit dollar Bulls.
Recent Comments